Reporting and analytics are crucial for understanding your business performance, tracking sales, and making informed decisions. This section details how to access and utilize sales reports, track customer behavior, and generate financial reports to keep your business on track.
Viewing Sales Reports
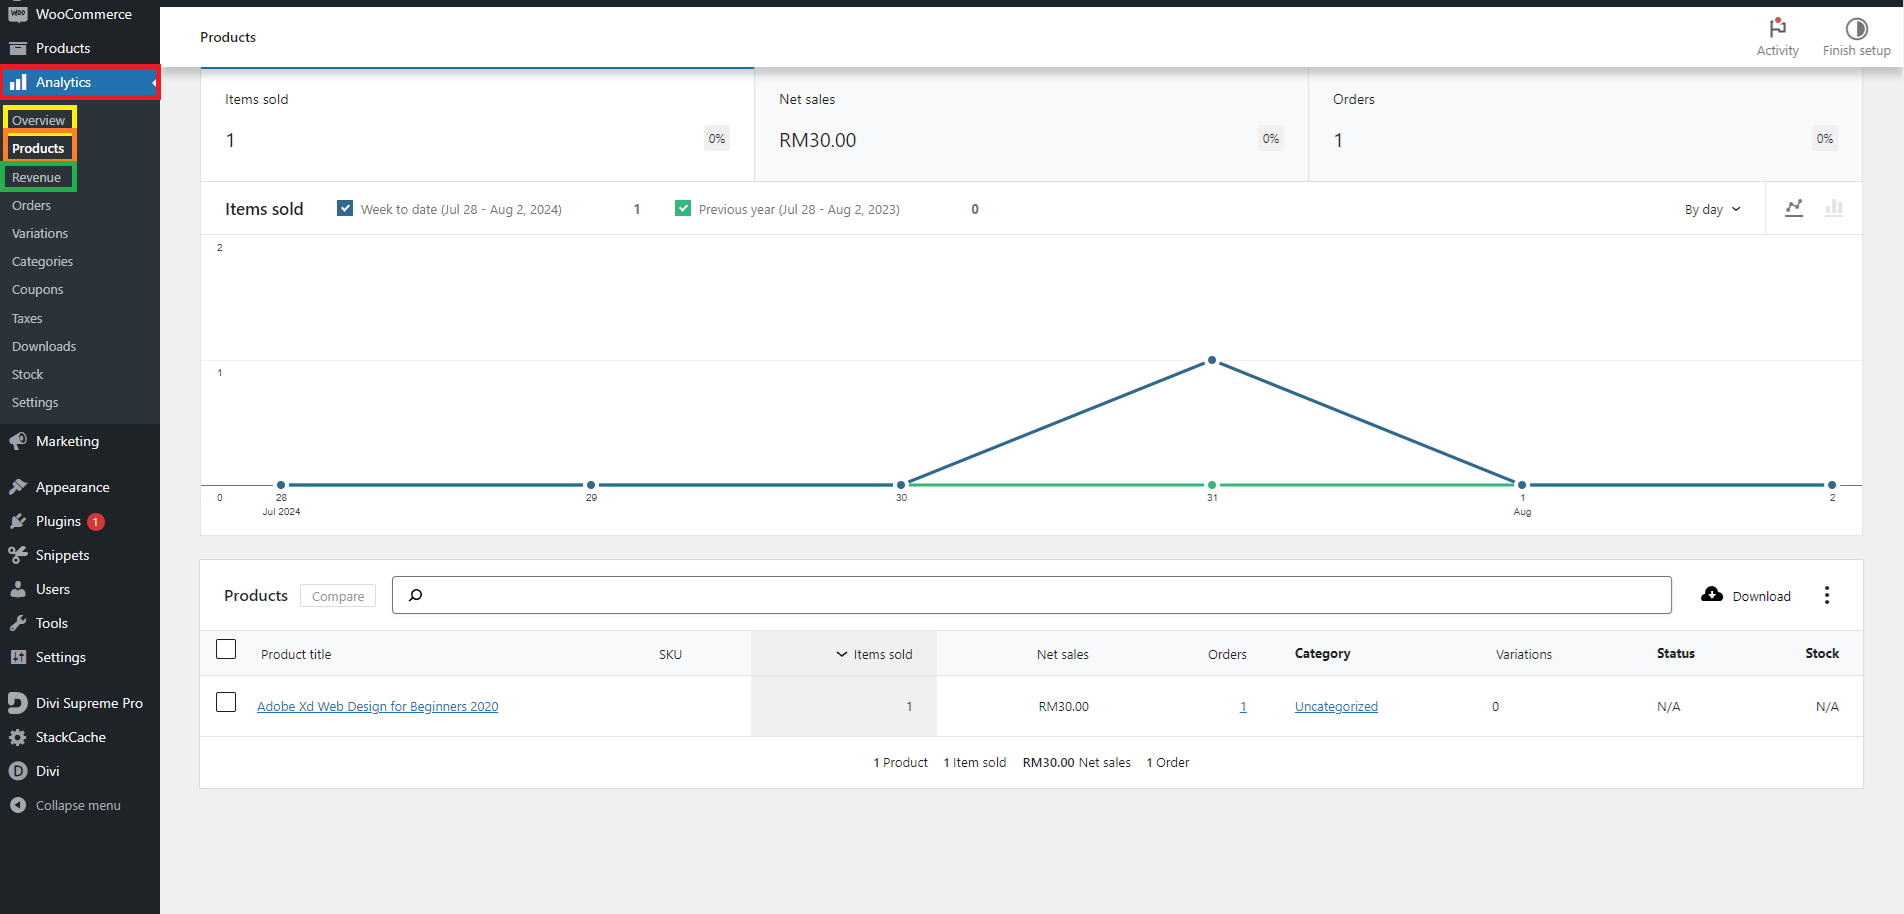
- Access Sales Reports
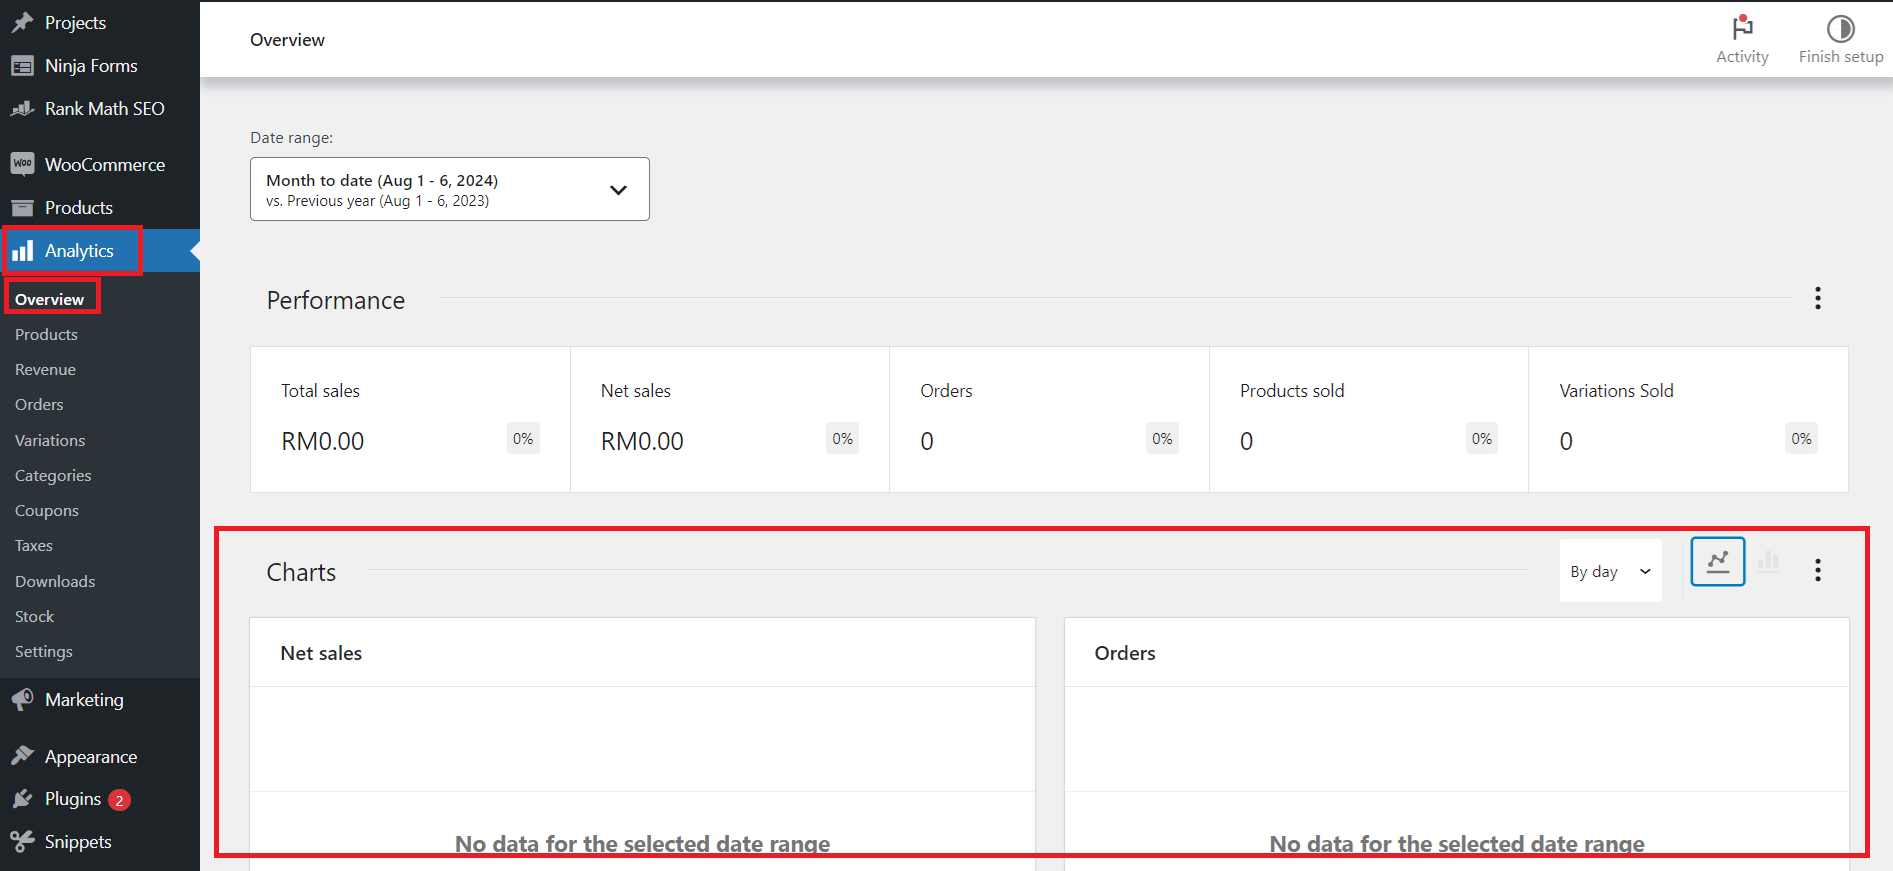
- Navigate to Reports Section:
- Go to the “Reports” or “Analytics” section in your admin dashboard.
- Select Sales Reports:
- Choose the type of sales report you want to view, such as “Sales Overview”, “Revenue Report”, or “Sales by Product”.
- Navigate to Reports Section:
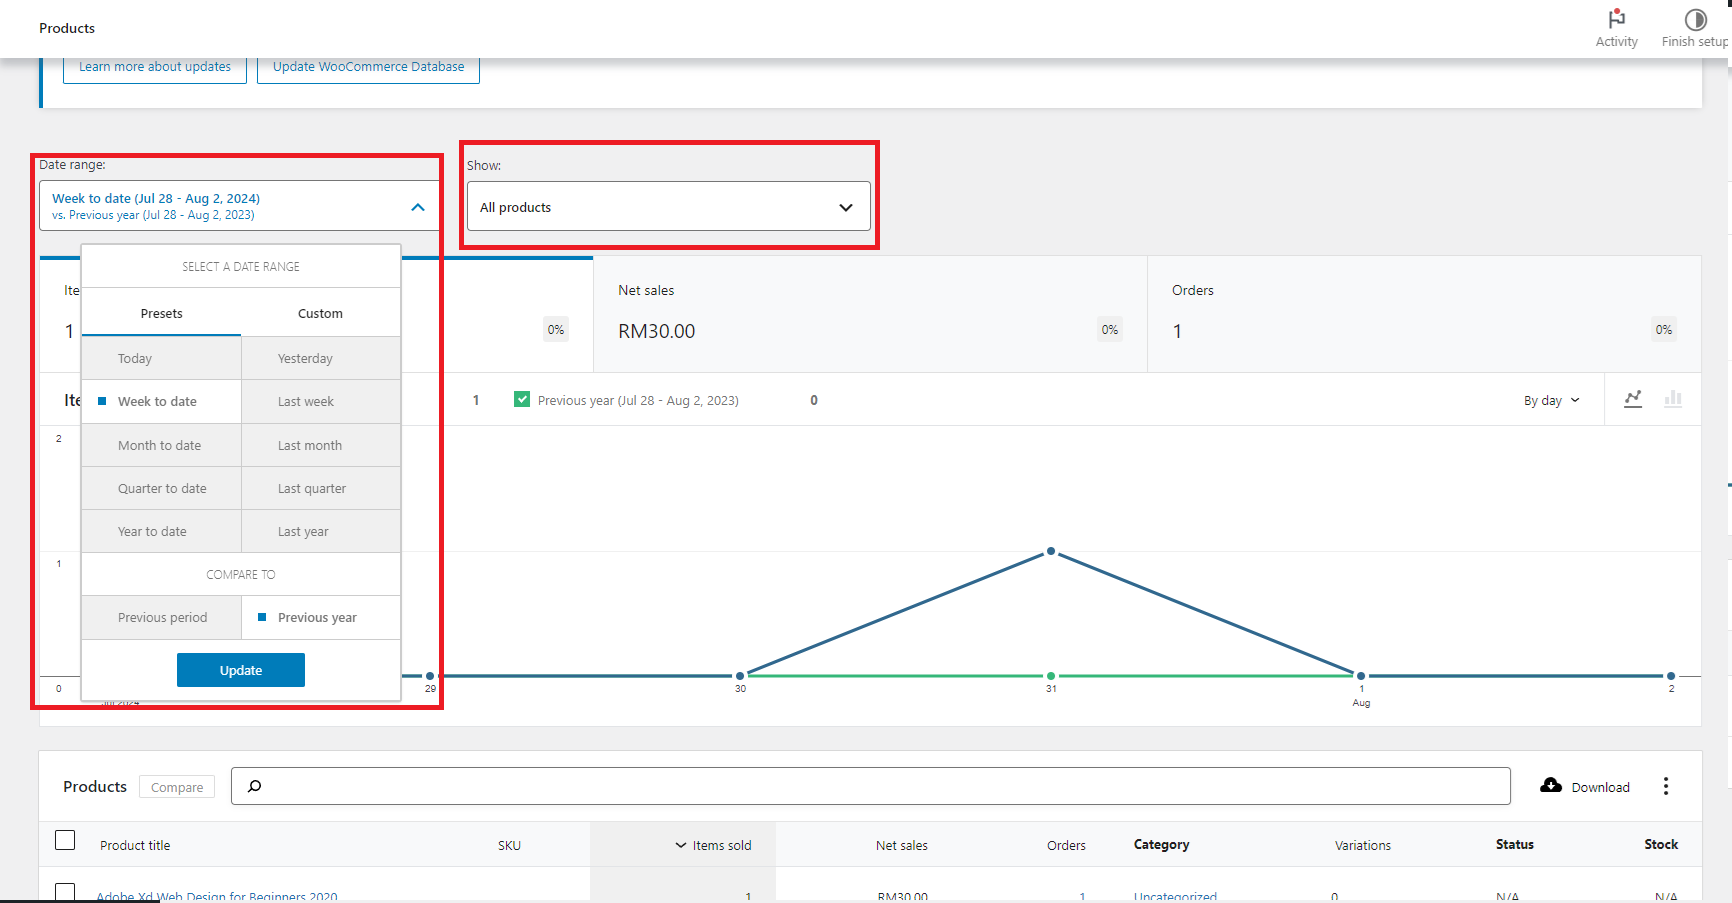
- Generate Sales Reports
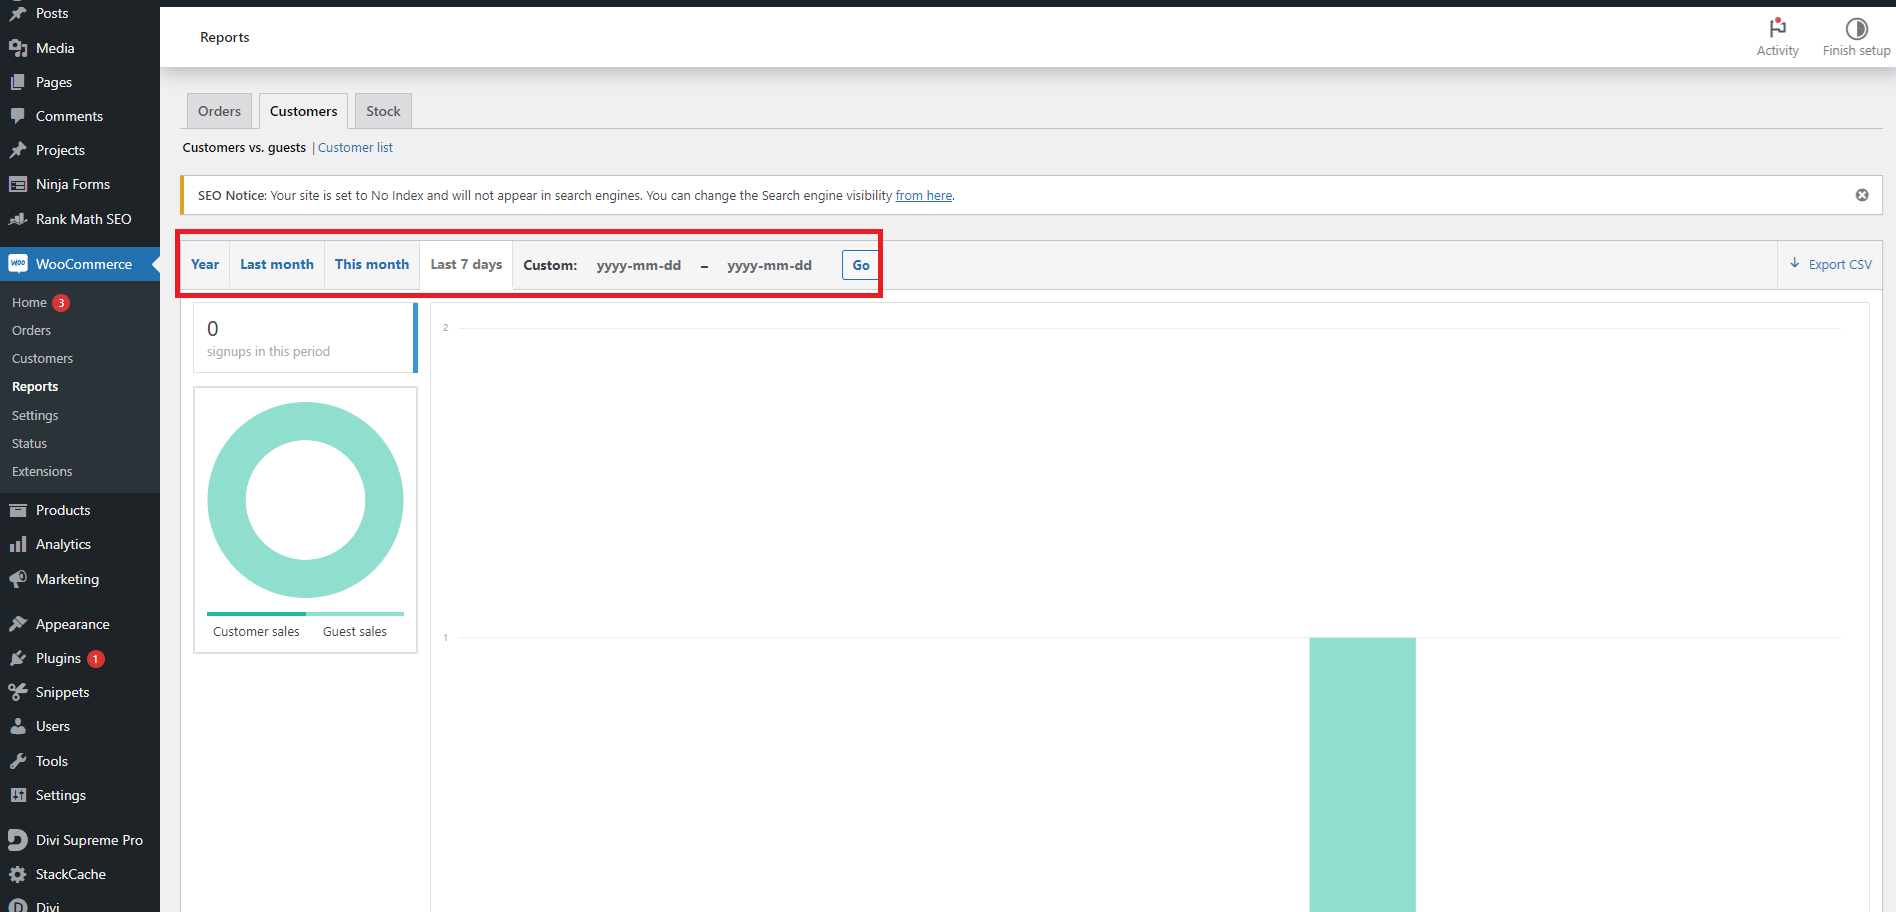
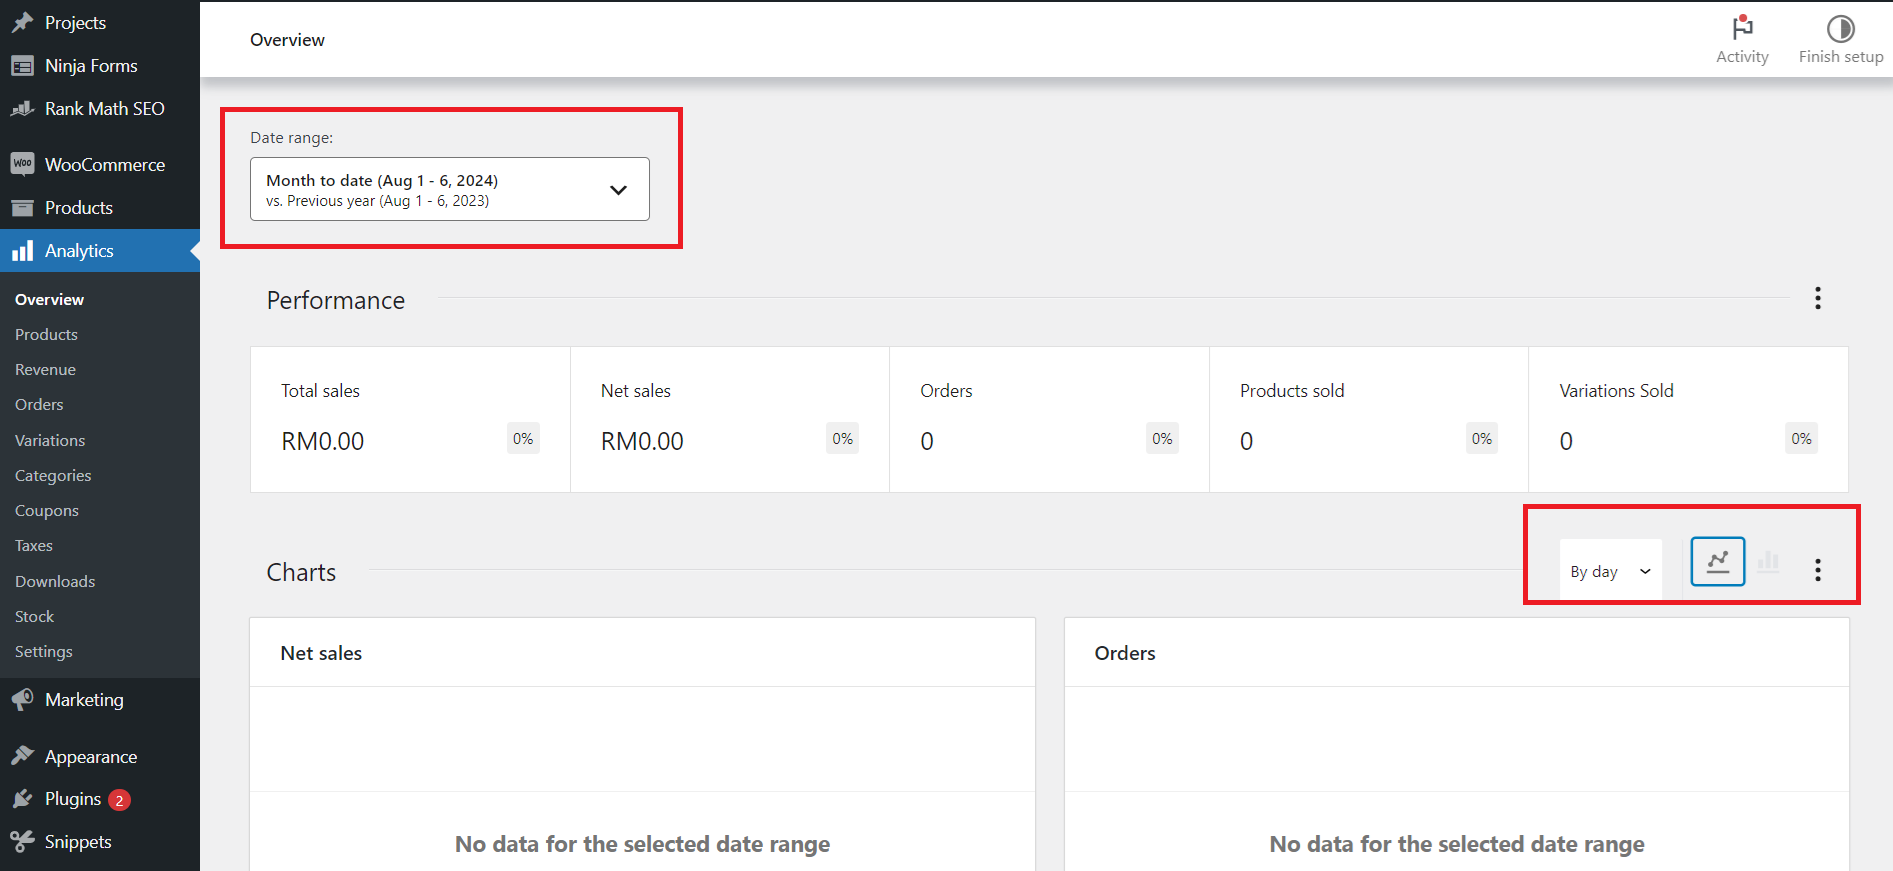
- Set Date Range:
- Specify the period for which you want to generate the report (e.g., daily, weekly, monthly, or custom date range).
- Filter Results:
- Apply filters based on criteria like product category, sales channel, or order status.
- View Report:
- Click “Generate Report” to view the sales data.
- Set Date Range:
- Analyze Sales Data
- Review Key Metrics:
- Examine key metrics such as total revenue, total orders, average order value, and sales by product or category.
- Identify Trends:
- Look for trends or patterns in your sales data to understand performance and identify areas for improvement.
- Review Key Metrics:
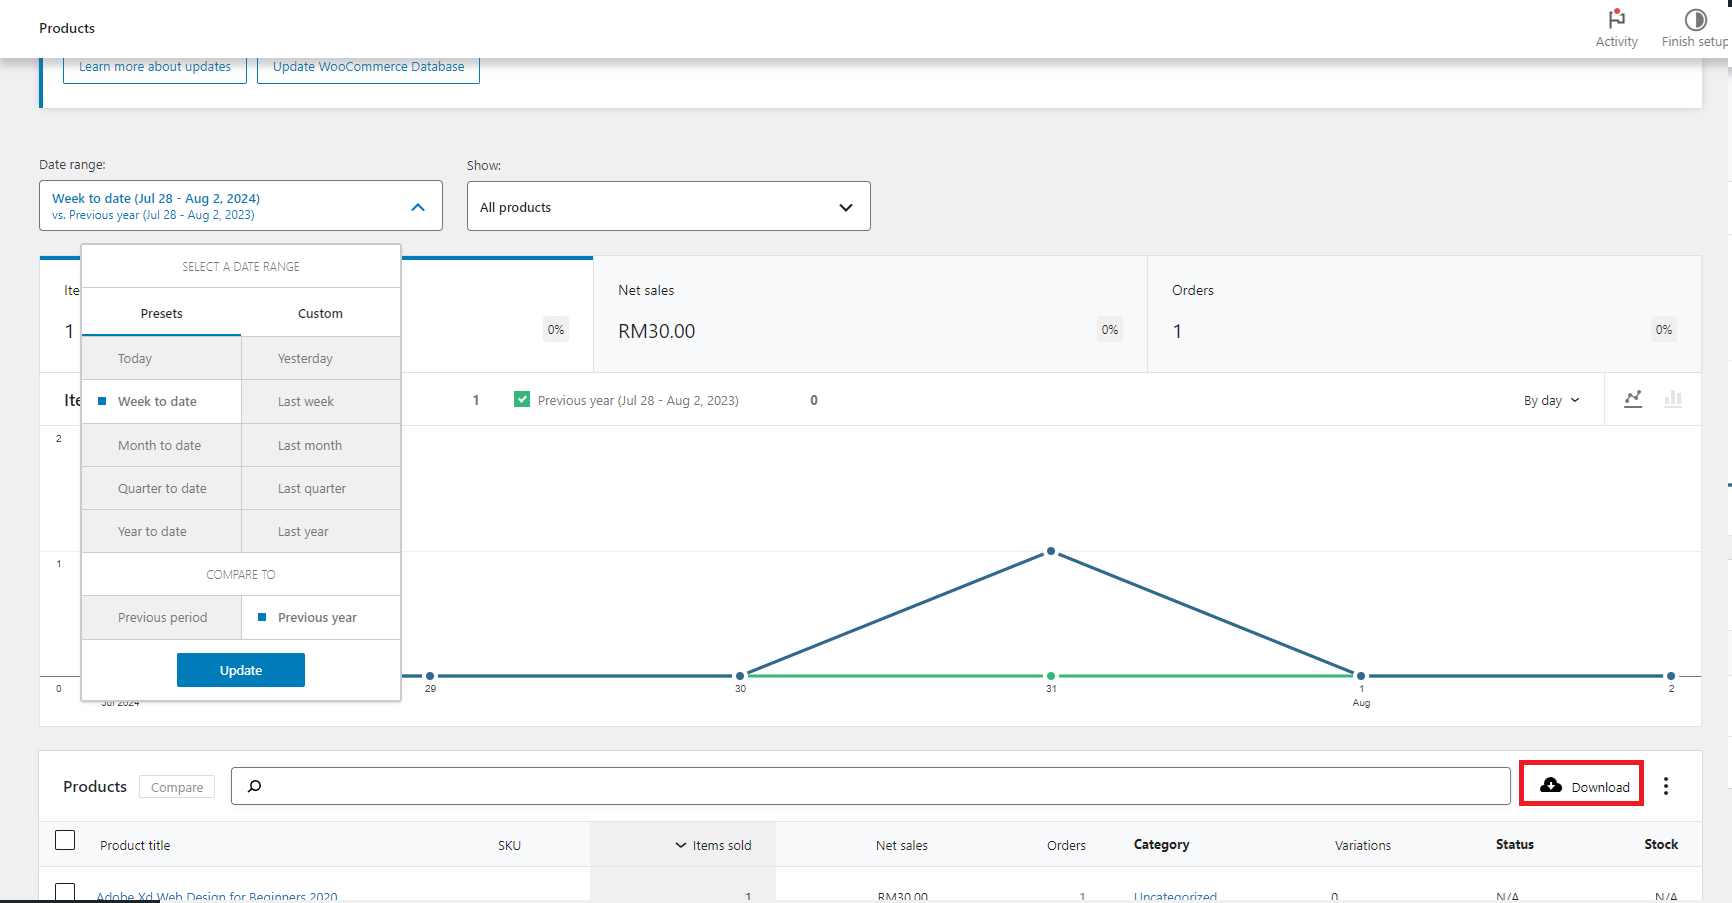
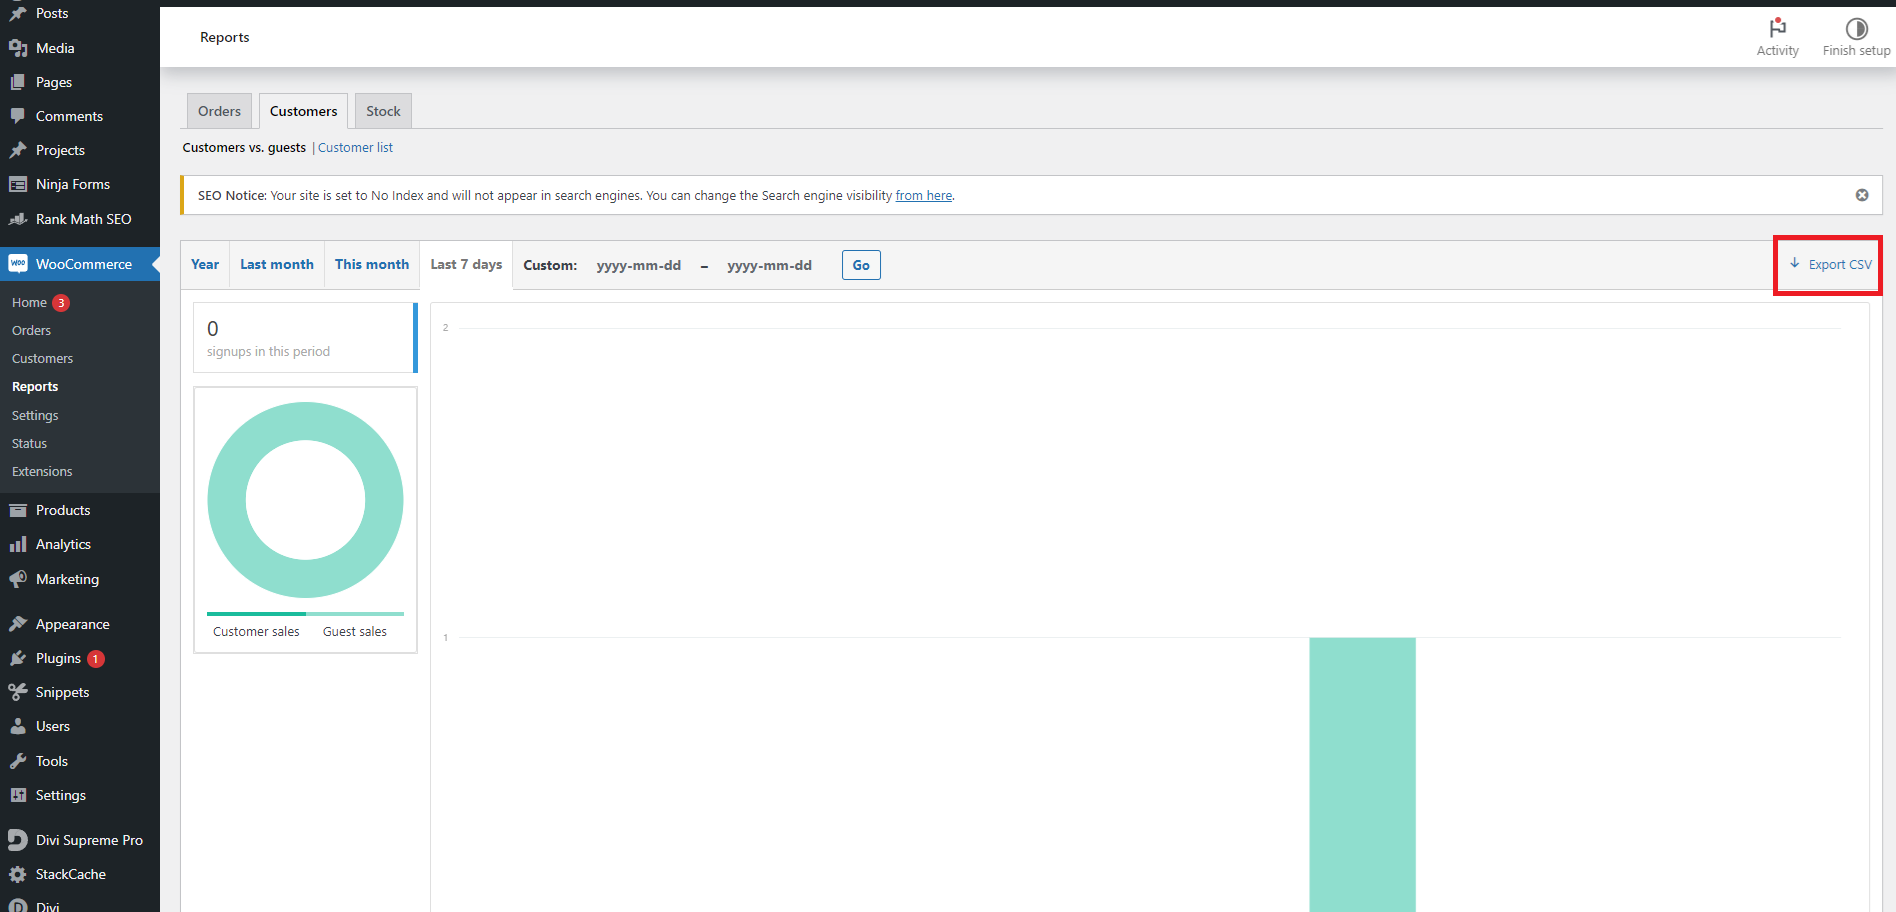
- Export Sales Reports
- Export Data:
- Export the report in formats like PDF or CSV for further analysis or sharing with stakeholders.
- Save Reports:
- Save the report to your system or cloud storage for future reference.
- Export Data:
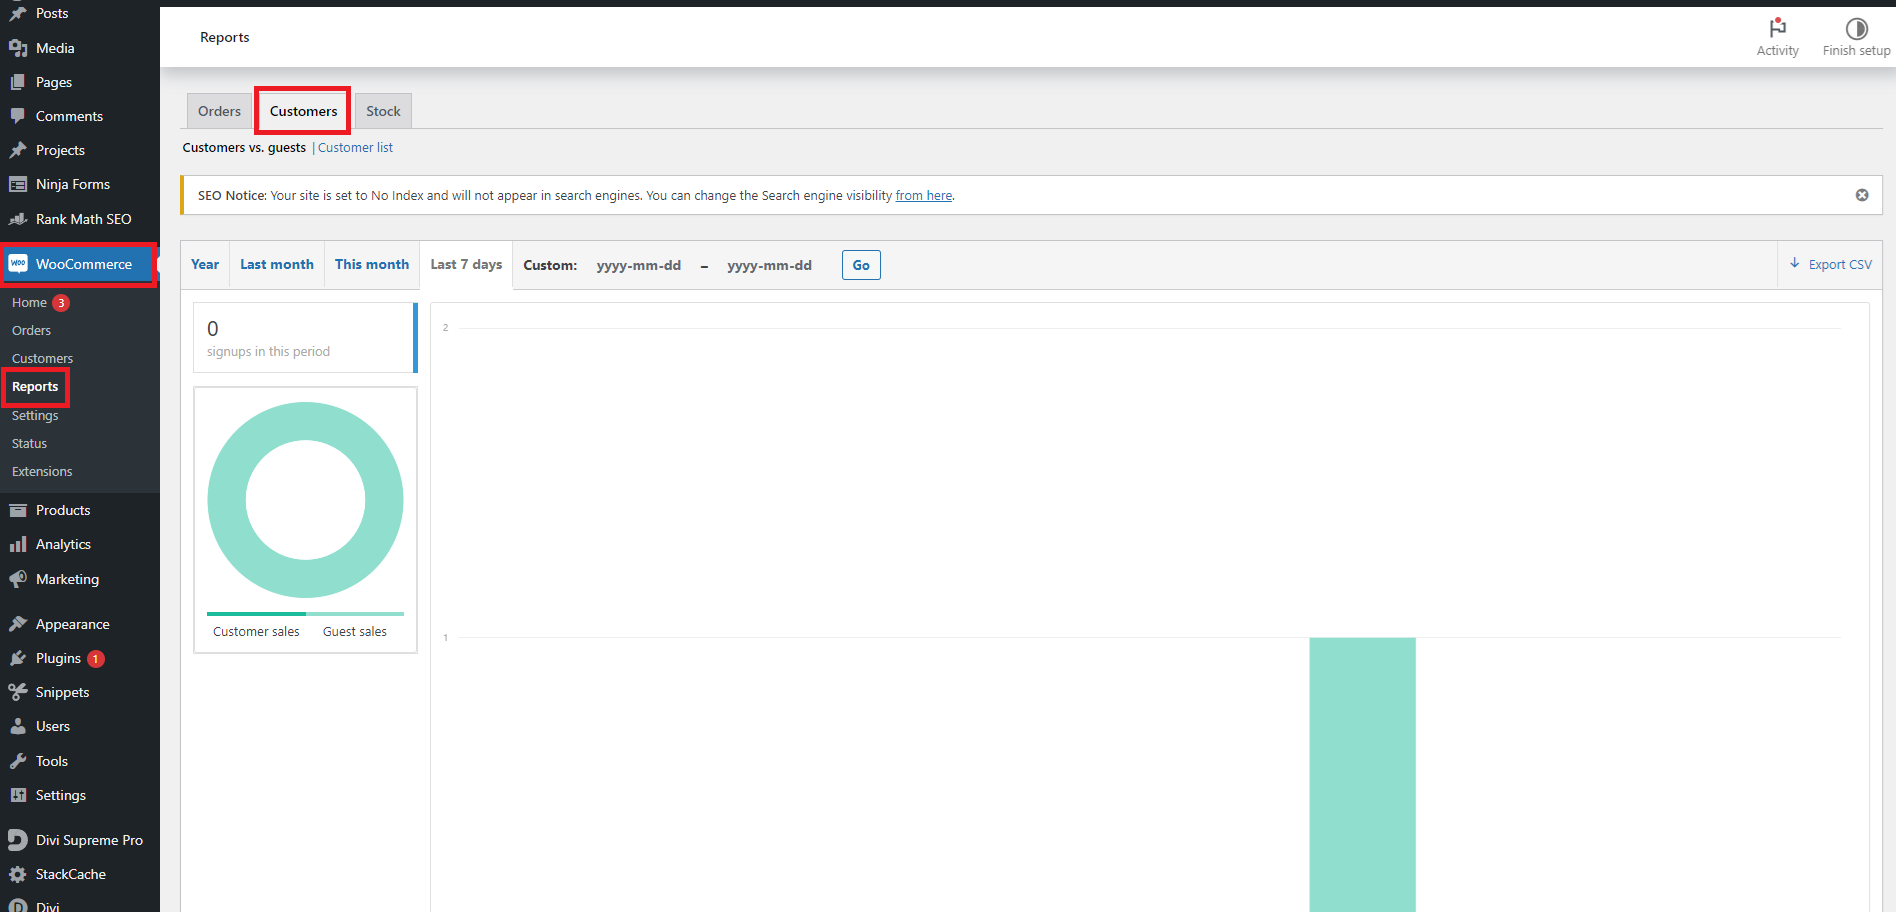
Tracking Customer Behavior
- Access Customer Analytics
- Navigate to Customer Insights:
- Go to the “Customer Analytics” or “Insights” section in your dashboard.
- Select Customer Behavior Reports:
- Choose reports such as “Customer Retention”, “Customer Acquisition”, or “Customer Lifetime Value”.
- Navigate to Customer Insights:
- Generate Customer Behavior Reports
- Set Date Range:
- Define the period for which you want to analyze customer behavior.
- Filter Results:
- Apply filters based on criteria like customer segments, purchase frequency, or average order value.
- View Report:
- Click “Generate Report” to view the customer behavior data.
- Set Date Range:
- Analyze Customer Data
- Review Key Metrics:
- Examine metrics such as customer retention rates, acquisition costs, and lifetime value.
- Identify Patterns:
- Look for patterns in customer behavior to understand buying habits and preferences.
- Review Key Metrics:
- Export Customer Reports
- Export Data:
- Export the report in formats like PDF or CSV for detailed analysis or presentation.
- Save Reports:
- Save the report to your system or cloud storage for future reference.
- Export Data:
Generating Financial Reports
- Access Financial Reports
- Navigate to Financial Reporting:
- Go to the “Financial Reports” or “Accounting” section in your dashboard.
- Select Financial Reports:
- Choose reports such as “Profit and Loss Statement”, “Balance Sheet”, or “Cash Flow Statement”.
- Navigate to Financial Reporting:
- Generate Financial Reports
- Set Date Range:
- Define the period for which you want to generate financial reports.
- Filter Results:
- Apply filters based on criteria like financial year, department, or account type.
- View Report:
- Click “Generate Report” to view the financial data.
- Set Date Range:
- Analyze Financial Data
- Review Key Metrics:
- Examine key financial metrics such as total profit, total expenses, and cash flow.
- Assess Financial Health:
- Analyze the financial health of your business by reviewing profit margins, expense ratios, and cash reserves.
- Review Key Metrics:
- Export Financial Reports
- Export Data:
- Export the report in formats like PDF or CSV for detailed analysis or sharing with financial advisors.
- Save Reports:
- Save the report to your system or cloud storage for future reference.
- Export Data: